
Hi, in a previous post we created and configured the Cowrie SSH honeypot. A simple, easy and quick way to gather information, malicious IPs, uncover C2 servers, collect downloaded files, executables and scripts associated with cryptominers, reverse shells, DDoS attacks and much more.
However, SSH is just one of the many services that attackers might try to exploit, how about web facing applications, SQL servers, SIP, exposed RDP; Sounds interesting right? I know it definitely looks interesting from the attacker’s perspective.
So, wouldn’t it be dreamy, to have all of the mainstream services and protocols an attacker might try to exploit bundled in one juicy exploitable server?
Enter t-pot, the all in one, optionally distributed, multiarch (amd64, arm64) honeypot plattform, supporting 20+ honeypots and countless visualization options using the Elastic Stack, animated live attack maps and lots of security tools to further improve the deception experience.
The best part? It’s easy and free.
In this post we will go through the installation & basic configuration of t-pot using a VM on our favorite cheap-o cloud provider Hetzner.
Introduction
T-Pot is a very complex and feature rich project but it’s installation is extremely easy and automated, so before we start, I urge you to take the time and read the well-written table of contents and documentation.
Due to the nature of the project, always keep in mind that system compromise can’t be ruled out, so make sure to avoid hosting any sensitive data or PII on the VM and it’s honeypots.
For t-pot to be able to run it’s plethora of tools & honeypots simultaneously and somewhat segment each service (creates virtual filesystems when service requires it), it makes use of containers (docker/docker-compose).
System Requirements
T-Pot requires 8-16GB of RAM and more than 128GB of storage (SSD). Since the project is vulnerable by design, hosting it on the cloud sounds the logical move, in addition we won’t have to worry about port forwarding since we will use a VM with a dedicated IP. However if your environment requires port forwarding, know that t-pot uses these ports for it’s services.
Also, keep in mind that for some honeypots to reach full functionality (i.e. Cowrie or Log4Pot) outgoing connections are necessary as well, in order for them to download the attackers malware.
Installation
Surprisingly, t-pot’s installation is really straight forward, all we need to do is follow the steps for the Post Install User Method.
For this tutorial I will be using a Debian 11 VM with 16GB RAM, 4vCPU and 160GB of SSD storage.
Once the VM is provisioned login and let’s get started, note that naturally we will need root access to the VM.
T-Pot uses two different types of accounts. Make sure you know the differences of the different account types, since it is by far the most common reason for authentication errors and fail2ban lockouts.
Now, let’s make sure that the VM is updated and install the prerequisites :
# apt-get update && apt upgrade -y
# apt install git -y
Next, grab the code and run the installation script :
# git clone https://github.com/telekom-security/tpotce
# cd tpotce/iso/installer/
# ./install.sh --type=user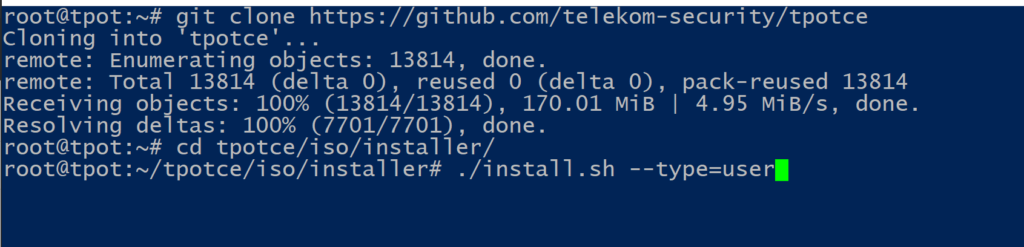
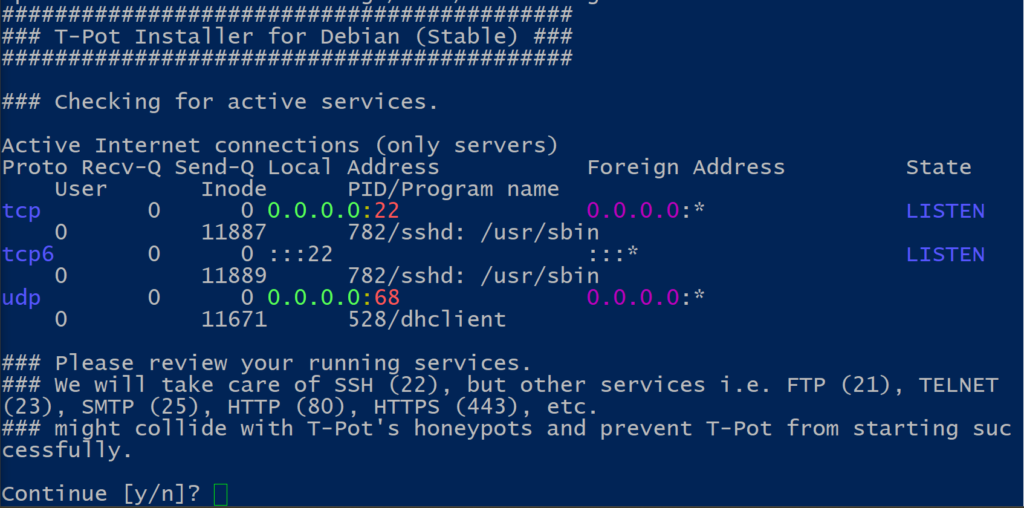
At this point, make sure that other services are not using the ports required for the honeypots ; also note that the VM’s SSH service will be forwarded to port 64295. Choose yes and proceed.
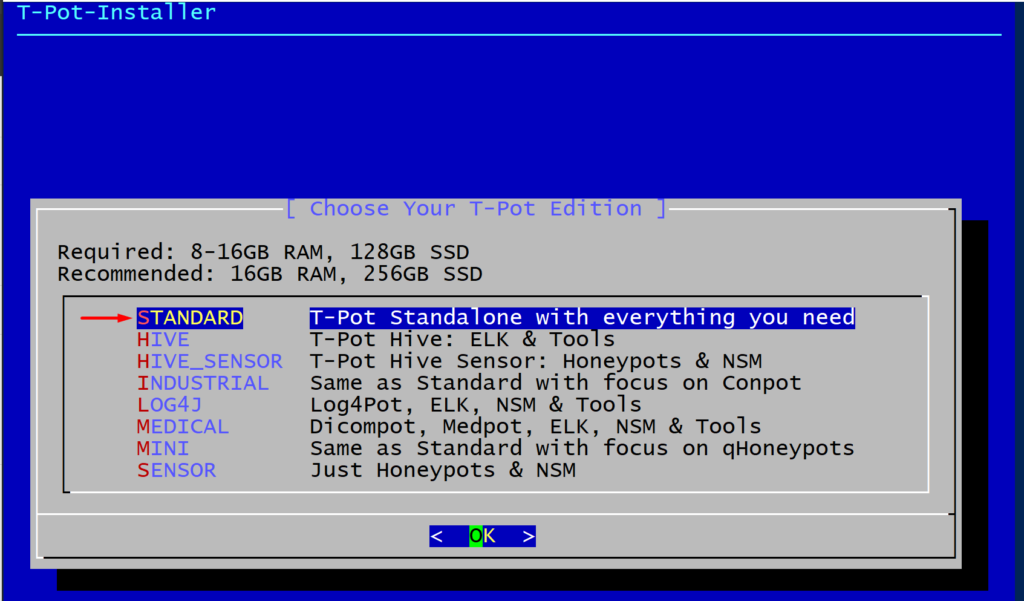
In the next step we will be presented with the different editions of t-pot, we will go with the standard standalone edition which contains all the tools and honeypots.
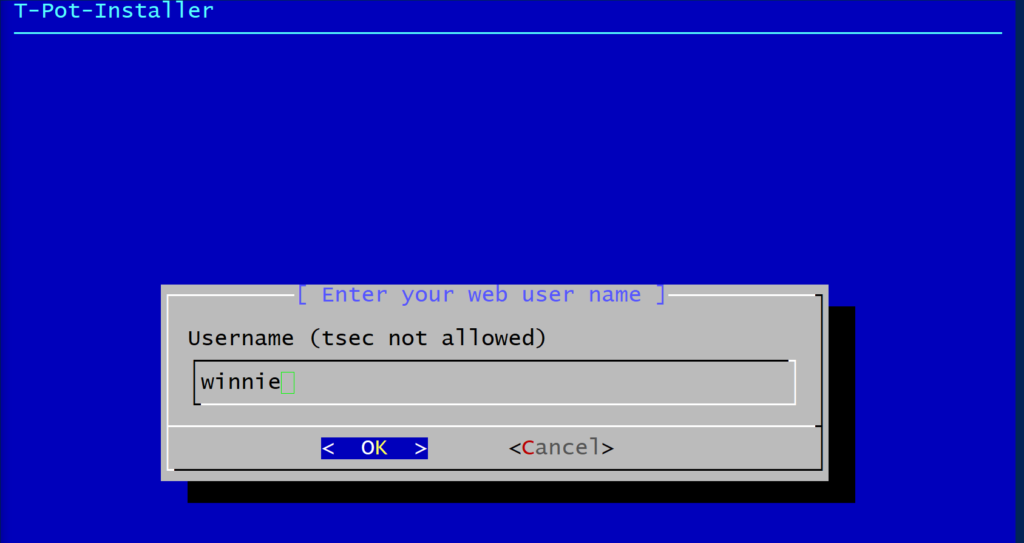
Next we need to create a web user (nginx). This will be the user/password used to login in our tpot web dashboard.
Take note of the username and password and proceed.
The installer will now download and verify all the required images and create the required containers. Once this completes it will automatically reboot the VM.
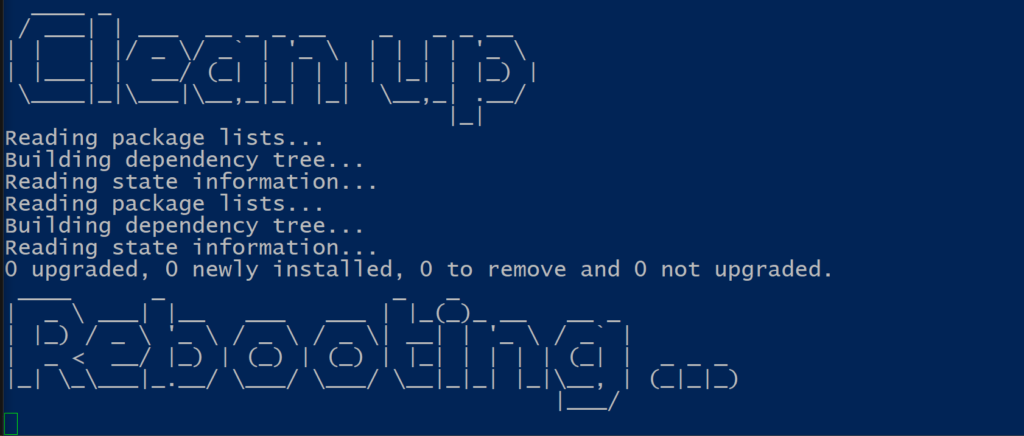
Access and interaction
Once the reboot completes you can ssh to your honeypot and verify if all services are up and running, the ports that are being used along with the system’s load average.
SSH
After installation SSH access via port 64295
ssh [email protected] -p 64295.
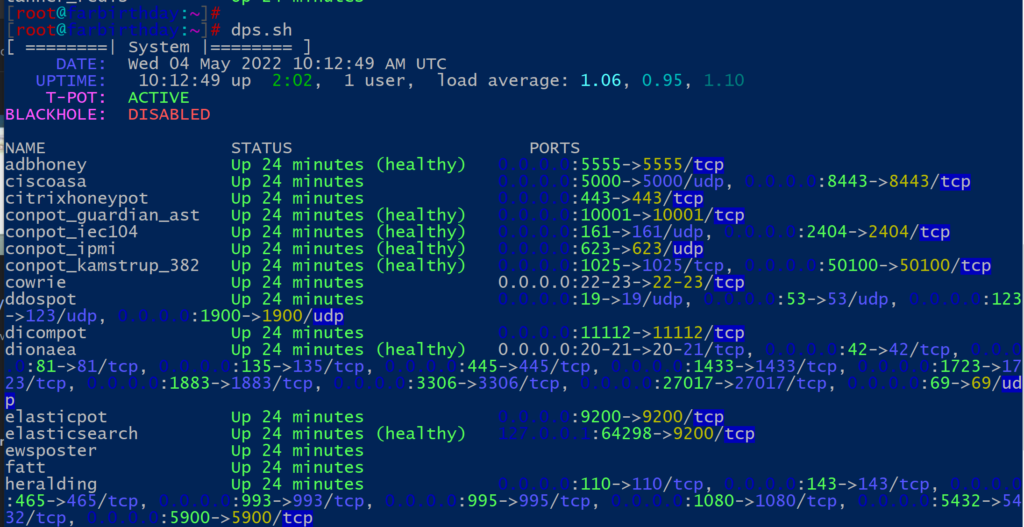
# dps.sh
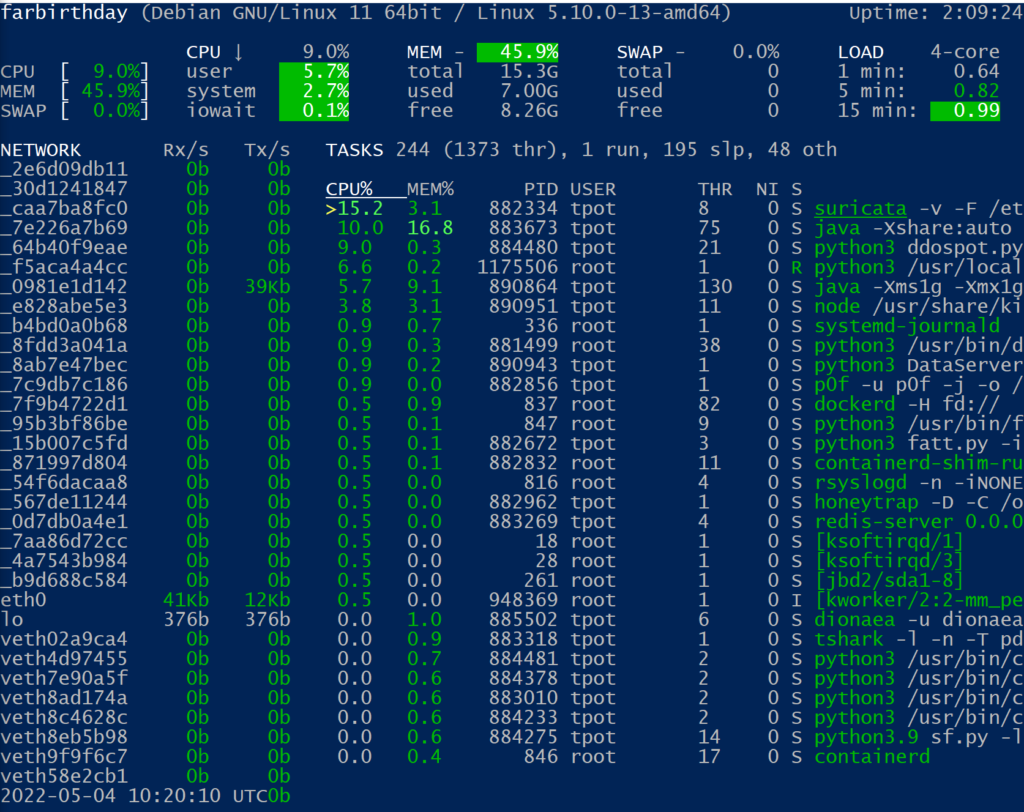
# glancesAdditionally you can view cpu/ram per service with the built in tool glances.
Web
From our web browser we can access the cockpit and the web portal.
The main page of our honeypot (web portal) can be accessed on https://x.x.x.x:64297/ using the credentials previously entered (in our case web user is winnie).

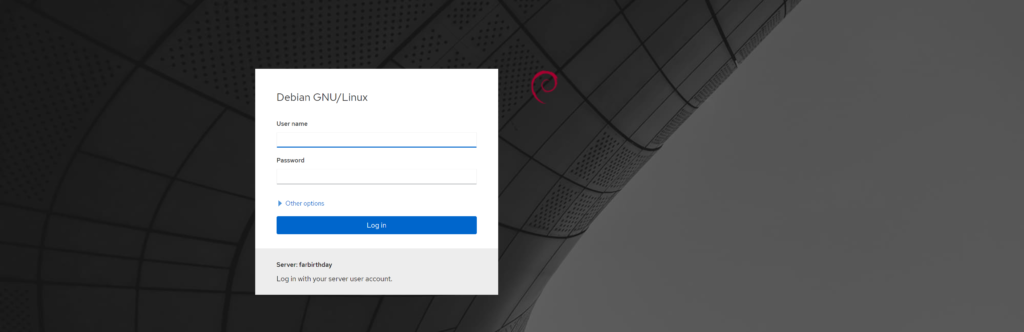
Access to cockpit is not allowed with root user so we will need to create another user in our VM, we can easily do that with :
usermod -aG sudo usernameOnce you have another user, you can access the cockpit :
https://x.x.x.x:64294/system
Dashboards
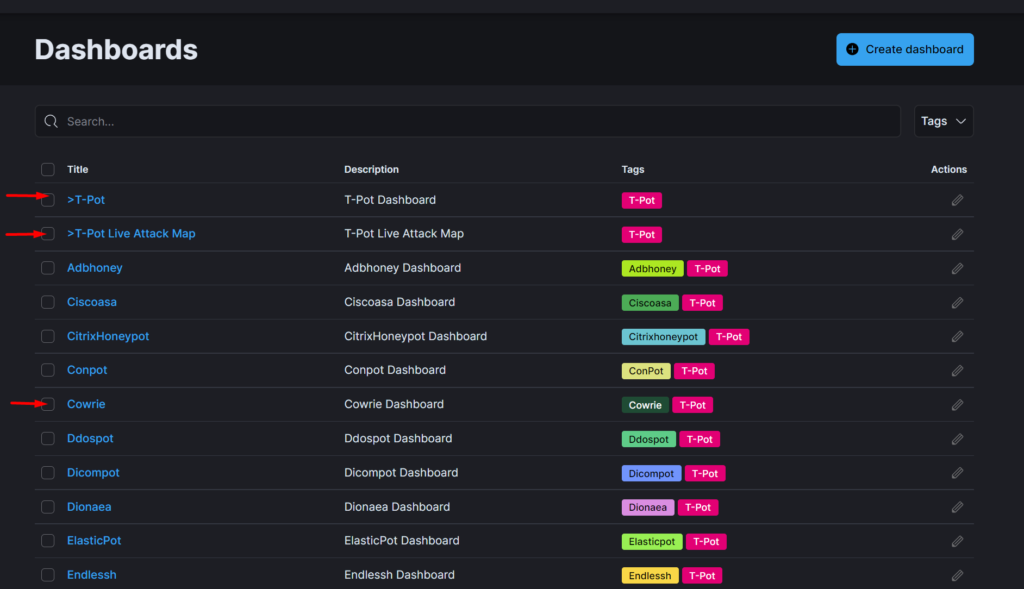
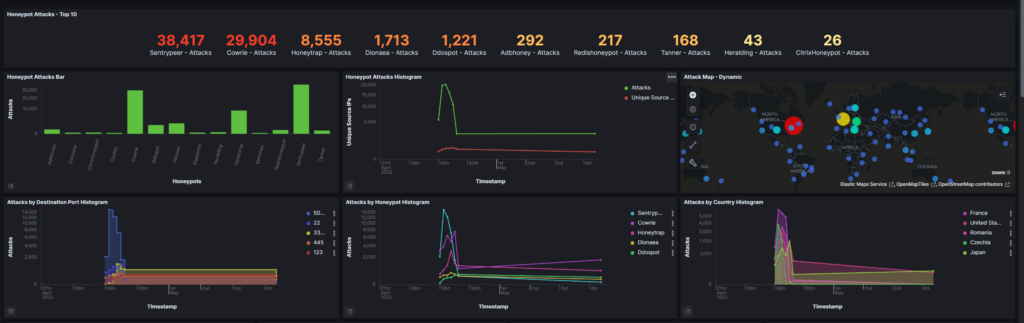
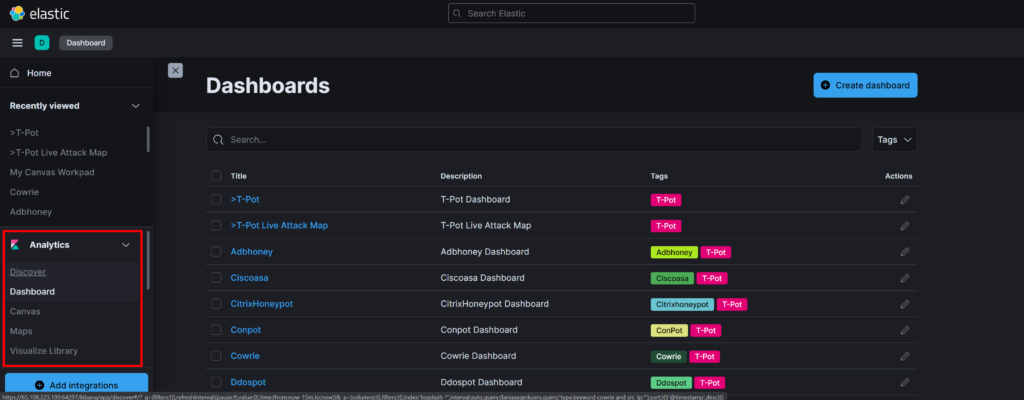
The heart of our honeypot is without a doubt the Dashboard (Kibana), which visualises all the data that our honeypots are generating.
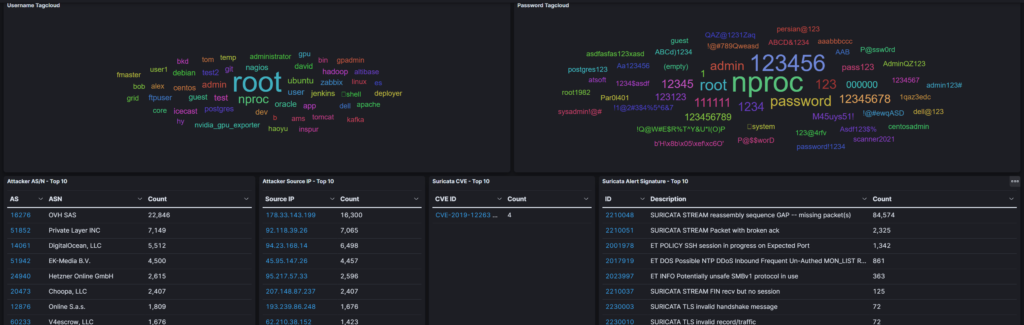
The dashboard contains a high level overview of all the honeypots, along with detailed graphs for each honeypot, the number of attacks that were captured, IPs, top offending countries and many more.
You can customize the boards and graphs to your liking.
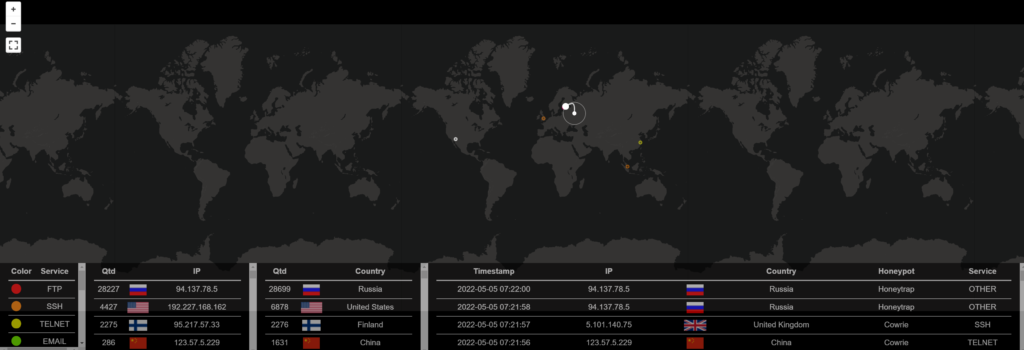
Additional visualizations can be found under the security meter and the live attack map which display live attacks captured by every connected t-pot suite and the live attacks on your system.
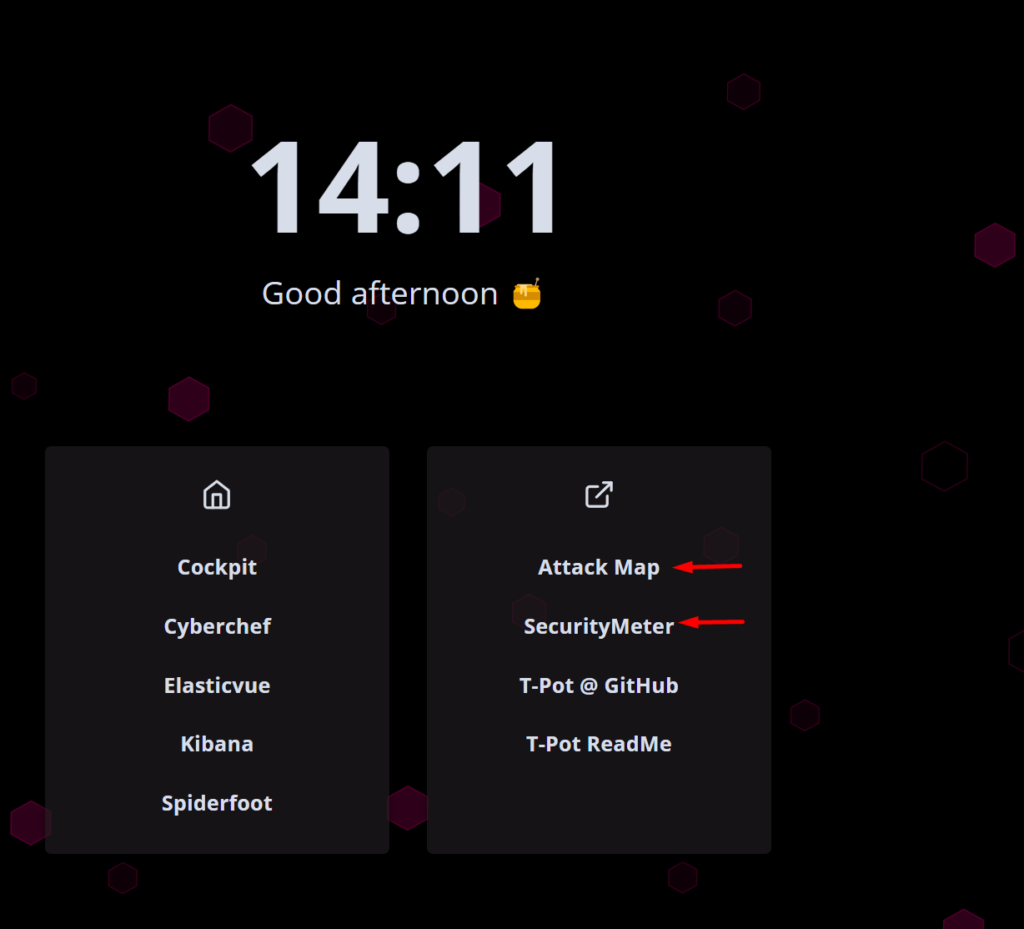
Attack map displays the services, counties, IPs and the honeypots capturing the traffic.
The logs of all the honeypots can be accessed through the “Discover” tab under the “Analytics” menu
I will leave you with a few interesting commands & files/paths.
Start/stop the entire honeypot
# systemctl start/stop tpot

Services health check
# dps.sh

List containers
# docker ps -a

Start/stop containers/services
# docker start/stop <container name>

All persistent log files from the honeypots, tools and T-Pot related
services are stored in /data. This includes collected artifacts
which are not transmitted to the Elastic Stack.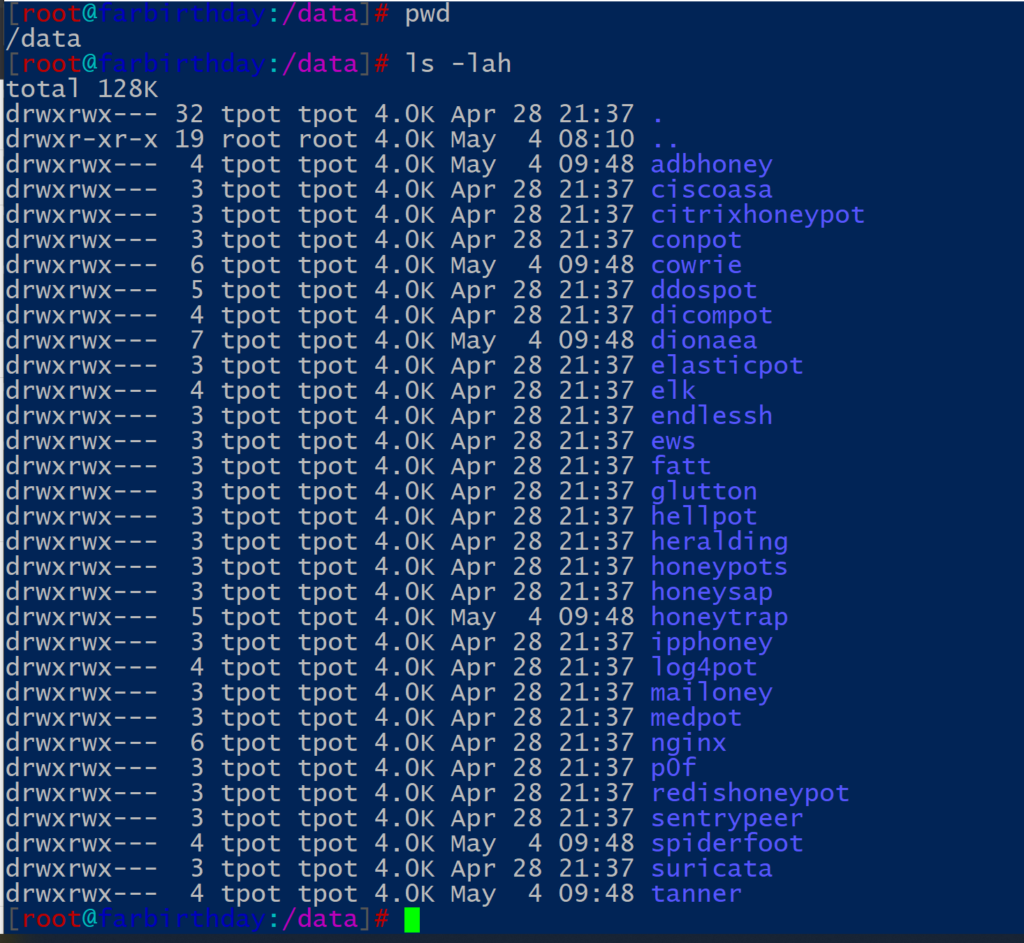
Since this post aims to demonstrate the setup and initial configuration of the T-Pot honeypot, the inner workings of the project are outside of the scope so we will not go through them.
However, if you want to dive deeper there are a few resources that can help you find additional information, such as the discussions & FAQ thread.
That’s all folks, hope you found this post useful.